The Air We Breathe
The United Nations Environment Program and World Health Organization now regard air pollution as the single largest threat to human health and the environment.
92%
of the world’s population breathe air above the WHO annual guideline
1 in 8
deaths worldwide is linked to pollution in the air
The real threat of air pollution
The smog hanging over cities like Los Angeles or Beijing is the most familiar and obvious form of air pollution. The United Nations Environment Program (UNEP) and World Health Organization (WHO) now regard air pollution as the single largest threat to human health and the environment.
There are many kinds of air pollution. Some pollution is visible to the naked eye. Most air pollution is not. Nearly all pollution is created by human activity. So what is it?
Scientists classify air pollution into two main categories:
Category one
Gases
CO2, sulfur dioxide, nitrogen oxides, methane
Category two
Suspended particles
Also known as particulate matter — microscopic liquid and solid particles
The mixture
Smog
Smog is the mixture of these two categories of pollutants.
WHO reports that over 92% of the world’s population are exposed to air pollution that is above the organization’s air quality guideline (AQG) annual mean levels of 10 μg/m3.
In terms of gases, carbon dioxide (CO2) is the main greenhouse pollutant that scientists and forward-looking governments are most concerned about. While all living things emit carbon dioxide, the bulk of CO2 emissions come from burning fossil fuels to power our cars, homes and factories. Since the industrial revolution, humans have raised the CO2 concentration higher than it has been for hundreds of thousands of years. The burning of fossil fuel for power and industrial factories produce other gaseous pollutants like sulfur dioxide, nitrogen oxides and methane, as well as particulate matter.
With respect to particulate matter (PM) pollution, these aerosols are microscopic liquid and solid particles suspended in the air.
Want to know more about air quality standards?
The US EPA monitors six criteria pollutants for the outdoors: lead (Pb), carbon monoxide (CO), sulfur dioxide (SO2), nitrogen dioxide (NO2), ozone (O3), and particulate matter (PM). These are part of the National Ambient Air Quality Standards (NAAQS). For a detailed look at the chemistry underlying these pollutants and their effects, see this page.
PM
Particulate matter
O3
Ozone
CO
Carbon monoxide
NO2
Nitrogen dioxide
SO2
Sulfur dioxide
Pb
Lead
What are the sources of PM?
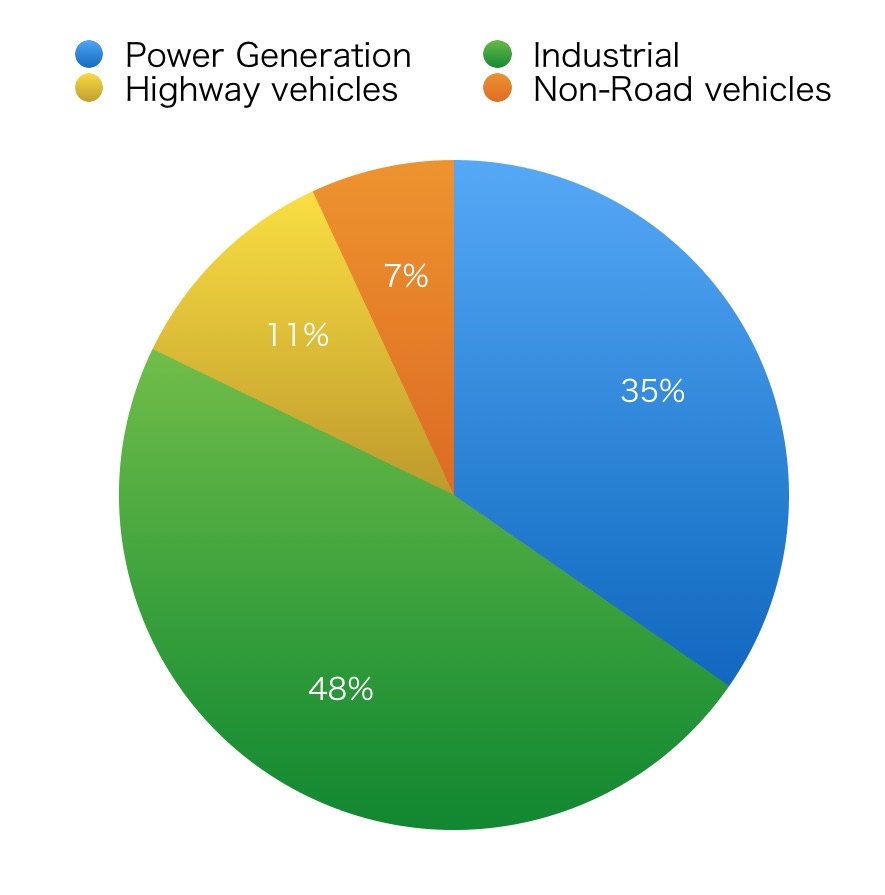
PM pollution is emitted directly from fossil fuel power plants, industrial sources, and automobile emissions. Like ozone, PM is also formed from the reaction of VOCs with SOX and NOX gases. 2.7 million tons of PM pollution are released in the US each year.
2.7M
tons of PM released in the US each year
Why does the particle size matter?
Particulate matter behaves differently depending on its size. They are classified as:
– PM10; 10 micrometers or less in diameter,
– PM2.5: 2.5 micrometers or less in diameter.
For reference, the width of a human hair is 100 micrometers. The larger PM10 particles do not remain airborne and tend to fall to the ground. Fine particulates, also known as PM2.5 can remain airborne for long periods and migrate thousands of miles.
What are the health effects of PM and ozone?
24M
people in the US have asthma
6M
of them are children, at least
$56B
estimated economic cost of asthma
There is overwhelming evidence of the health risks associated with exposure to inhaling PM2.5 and ozone. Those with heart or lung disease, the elderly, and children are at greater risk.
When inhaled, the particulates can penetrate the lower airways and some may even enter the bloodstream. Multiple studies show higher incidences of asthma, pneumonia, chronic obstructive pulmonary disease (COPD), heart disease, and stroke due to exposure. Today 24 million people in the US, including at least 6 million children have asthma. The economic cost of asthma is estimated to be at least $56 billion.
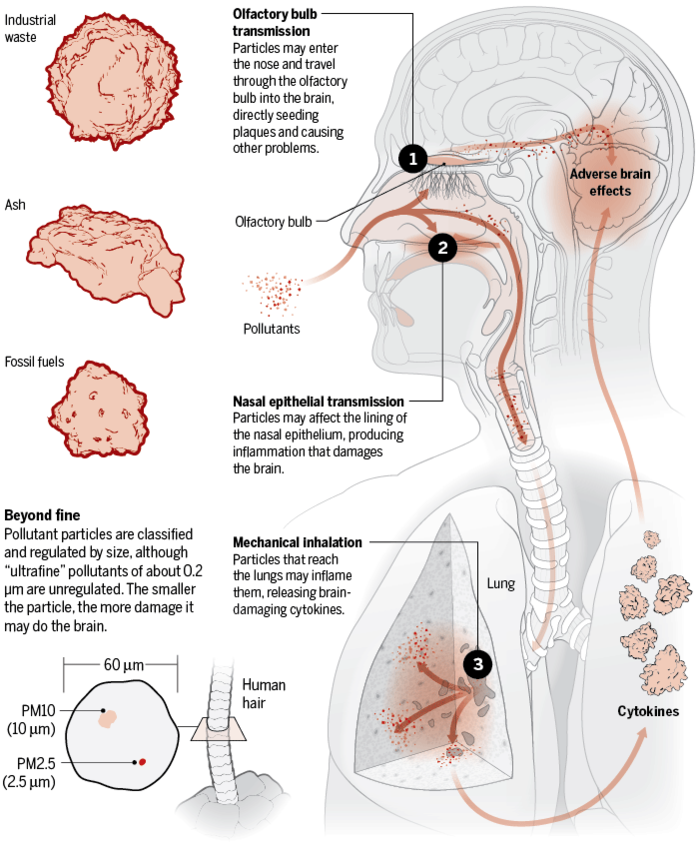
PM is also a known carcinogen. Recent research suggests particulates harm the brain. The effects include accelerated cognitive aging, and may contribute to higher likelihood of Alzheimer’s and other forms of dementia.
What are the average levels for PM?
The WHO recommends exposure of PM2.5 to be limited to 10 μg/m3 annual mean and 25 μg/m3 for any 24-hour period. For PM10, the exposure should be limited to 20 μg/m3 annual mean and 50 μg/m3 for any 24-hour period.
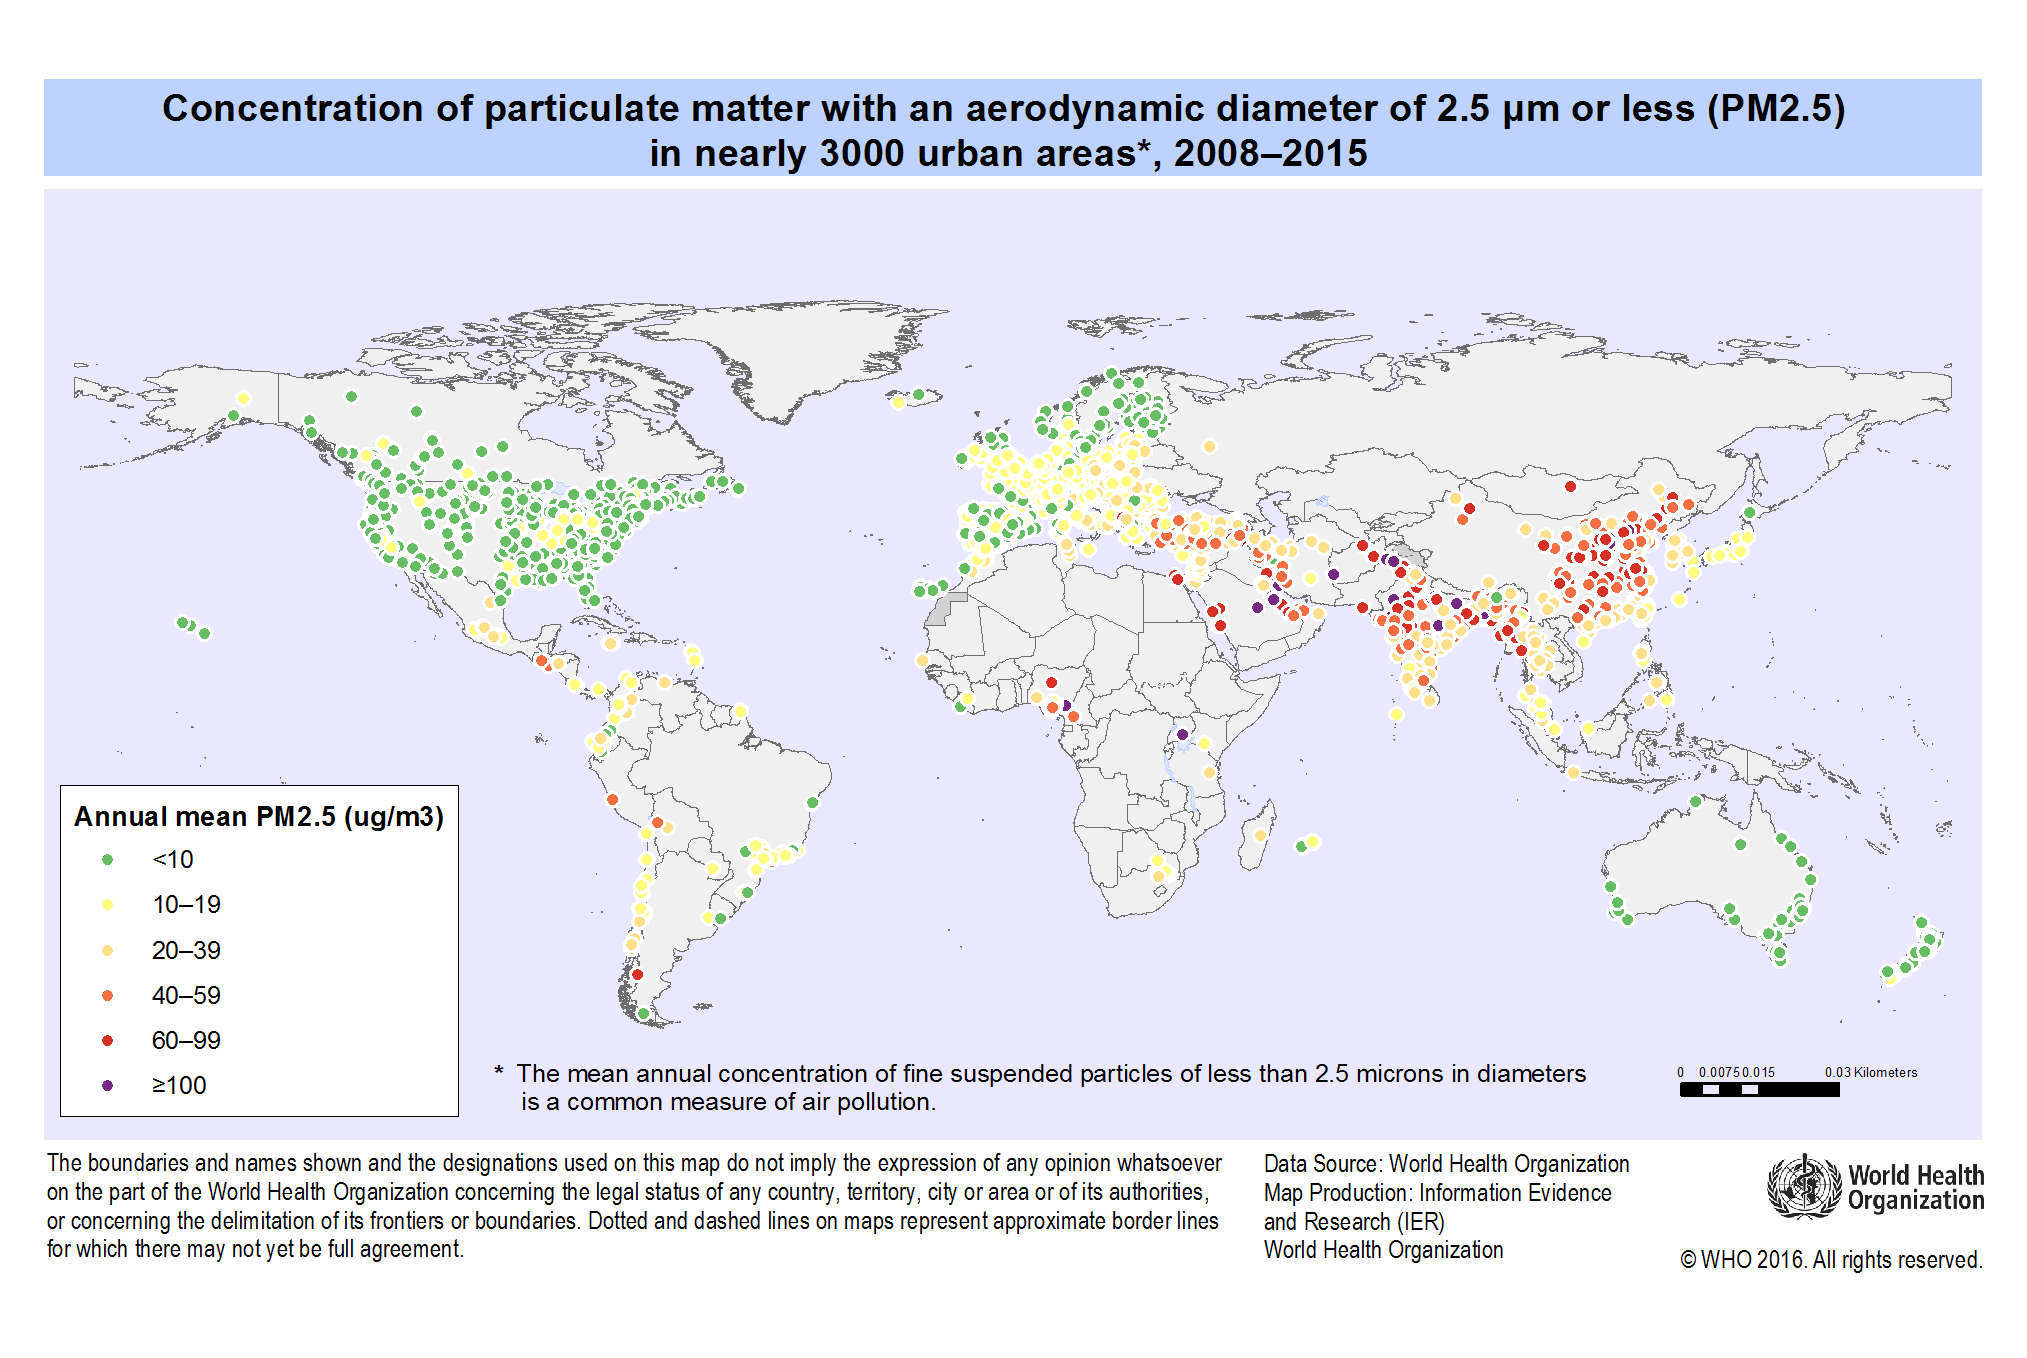
The concentration of PM depends on a number of factors such as proximity to power plants and highways. In urban areas, the average concentration of PM2.5 ranges from less than 10 to over 100 μg/m3 depending on the location and prevailing winds. For PM10, from 10 to over 200 μg/m3. In many developing countries the concentration of PM10 averages 70 μg/m3, far exceeding WHO guidelines.
Is the mix of air pollution the same around the world?
Eastern Europe
More sulfur dioxide and nitrogen oxides
More coal plants burning lignite coal. SO2 is also the source of acid rain.
San Francisco Bay Area
Less sulfur, more particulate matter
Fewer coal-fired power plants, but a large number of cars and major roadways.
Air pollution is not the same in different parts of the world. In Eastern Europe, where there are more coal plants burning lignite coal, we see more sulfur dioxide (also the source of acid rain) and nitrogen oxides. In the San Francisco Bay Area, there are fewer power plants that use coal so we see less sulfur but more particulate matter due to the number of cars and major roadways.
Topography, along with urban and building design, play critical roles in the dispersion and accumulation of air pollutants. A recent study in Central North Carolina suggests that previous studies may have underestimated premature death for individuals living within 1000 meters of a roadway.
Is there such a thing as air pollution at home?
Consumer products and building materials emit volatile organic compounds (VOCs). These are released from carpet, plywood, paint solvents, air fresheners, scented candles, glues, cleaners, etc. A common source of VOCs in the home is dry cleaned clothes. Your clothes may be washed in perchloroethylene or tetrachloroethylene.
Without adequate ventilation, VOCs and particulates concentrate in buildings, causing a wide range of health conditions known as “sick building syndrome” (SBS). Some VOCs cause eye irritation or breathing difficulty while others are known carcinogens and can trigger the formation of smog. Here is a link that summarizes household air pollution sources from the WHO.
In developing economies, indoor pollution affects 3 billion people who are exposed to smoke from the burning of coal, biomass, and animal dung for cooking, heating, and lighting.
3B
people in developing economies are exposed to indoor smoke from coal, biomass and animal dung
Air pollution and mortality
One in eight deaths worldwide is linked to pollution in the air. These contaminants cause a wide range of illnesses, including lung and heart diseases, as well as stroke and cancer. WHO estimates outdoor air pollution deaths to be 3.7 million and indoor air pollution deaths to be 4.3 million. This places air pollution as the fourth leading cause of death, following high blood pressure, dietary risks and smoking.
The IEA projects outdoor air pollution-related deaths could rise to 4.5 million per year due to massive growth in fossil-fuel use and desertification in Asia.
$225B
annual lost productivity, World Bank estimate
$5T
order of total cost once welfare is factored in
In addition to mortality, the economic cost of air pollution is staggering. Lost labor due to sick days, medical bills, and reduced agricultural output are among the damages. The World Bank estimates annual lost productivity to be at least $225 billion. When welfare costs are factored in, the costs balloon to an order of $5 trillion.
Where does pollution come from?
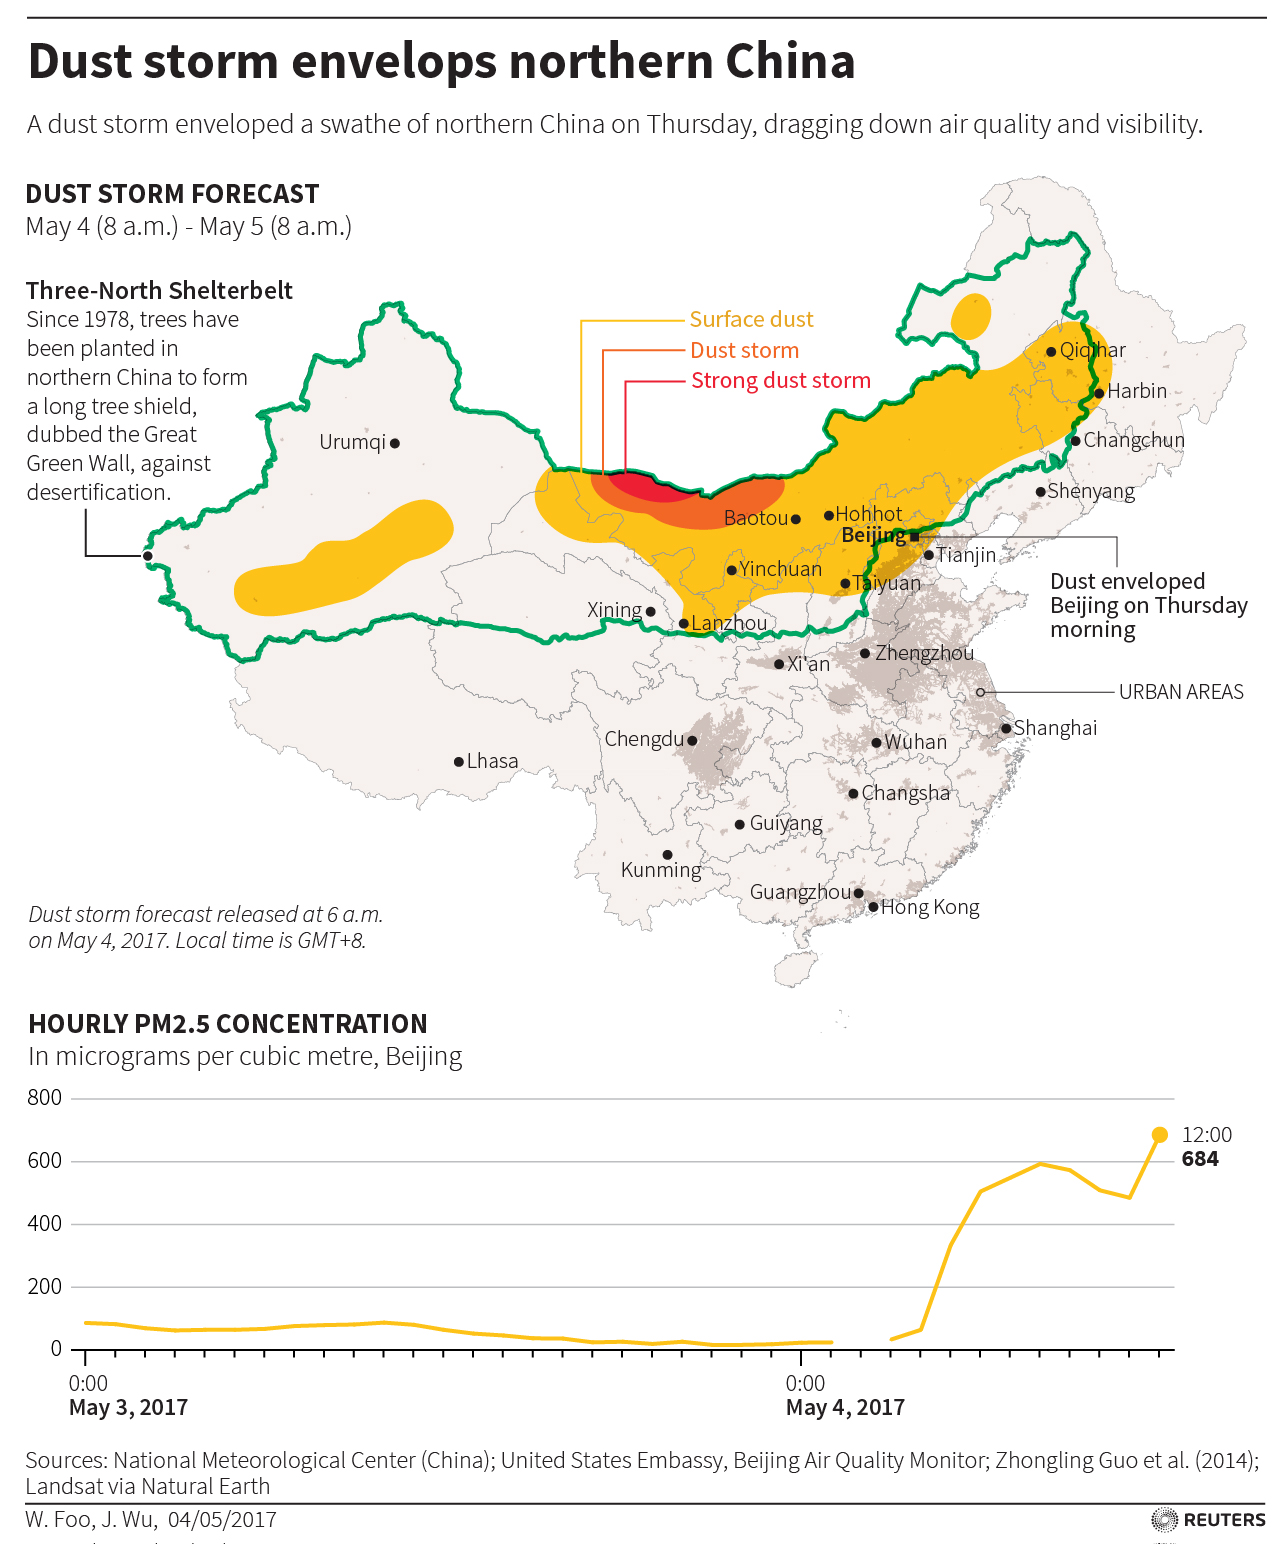
Industrialization, urbanization, desertification and the burning of fossil fuel have long-term consequences on air quality. There is no doubt human activity has an impact on air pollution. Globally, between 1979 and 2013, the global burnable area of long fire weather seasons has doubled due to drought. Most recently in China, deforestation has led to severe dust storms.
What about ozone?
6 to 30 miles up
Shields the planet
Ozone in the upper atmosphere blocks harmful UV rays.
At ground level
Toxic to humans and animals
Forms when ambient VOCs react with nitrogen oxides under sunlight. More likely when the weather is warm and sunny.
In addition to indoor emissions of VOCs, vehicles and power plants emit VOCs when fuel is not completely burned. They are also emitted from industrial sources that use chemical solvents and paints.
Ozone, a colorless gas, forms when ambient VOCs react with nitrogen oxides under sunlight. While ozone in the upper reaches of the atmosphere (6 to 30 miles above ground level) shields the planet from harmful UV rays, ozone at ground level is toxic to humans and animals. Ozone pollution is more likely to form when the weather is warm and sunny.
Ozone levels in western U.S. states continue to increase despite a 50% reduction in domestic emissions since 1990. This is due to pollutants that migrate thousands of miles from China, India, and other Asian countries, which are the fastest growing emitters in the world. Air pollution is not only a domestic issue. It is a transboundary problem that all countries face, regardless of their own emissions.
Is air pollution increasing in the US?
99%
fall in airborne lead — the most dramatic reduction of the six criteria pollutants
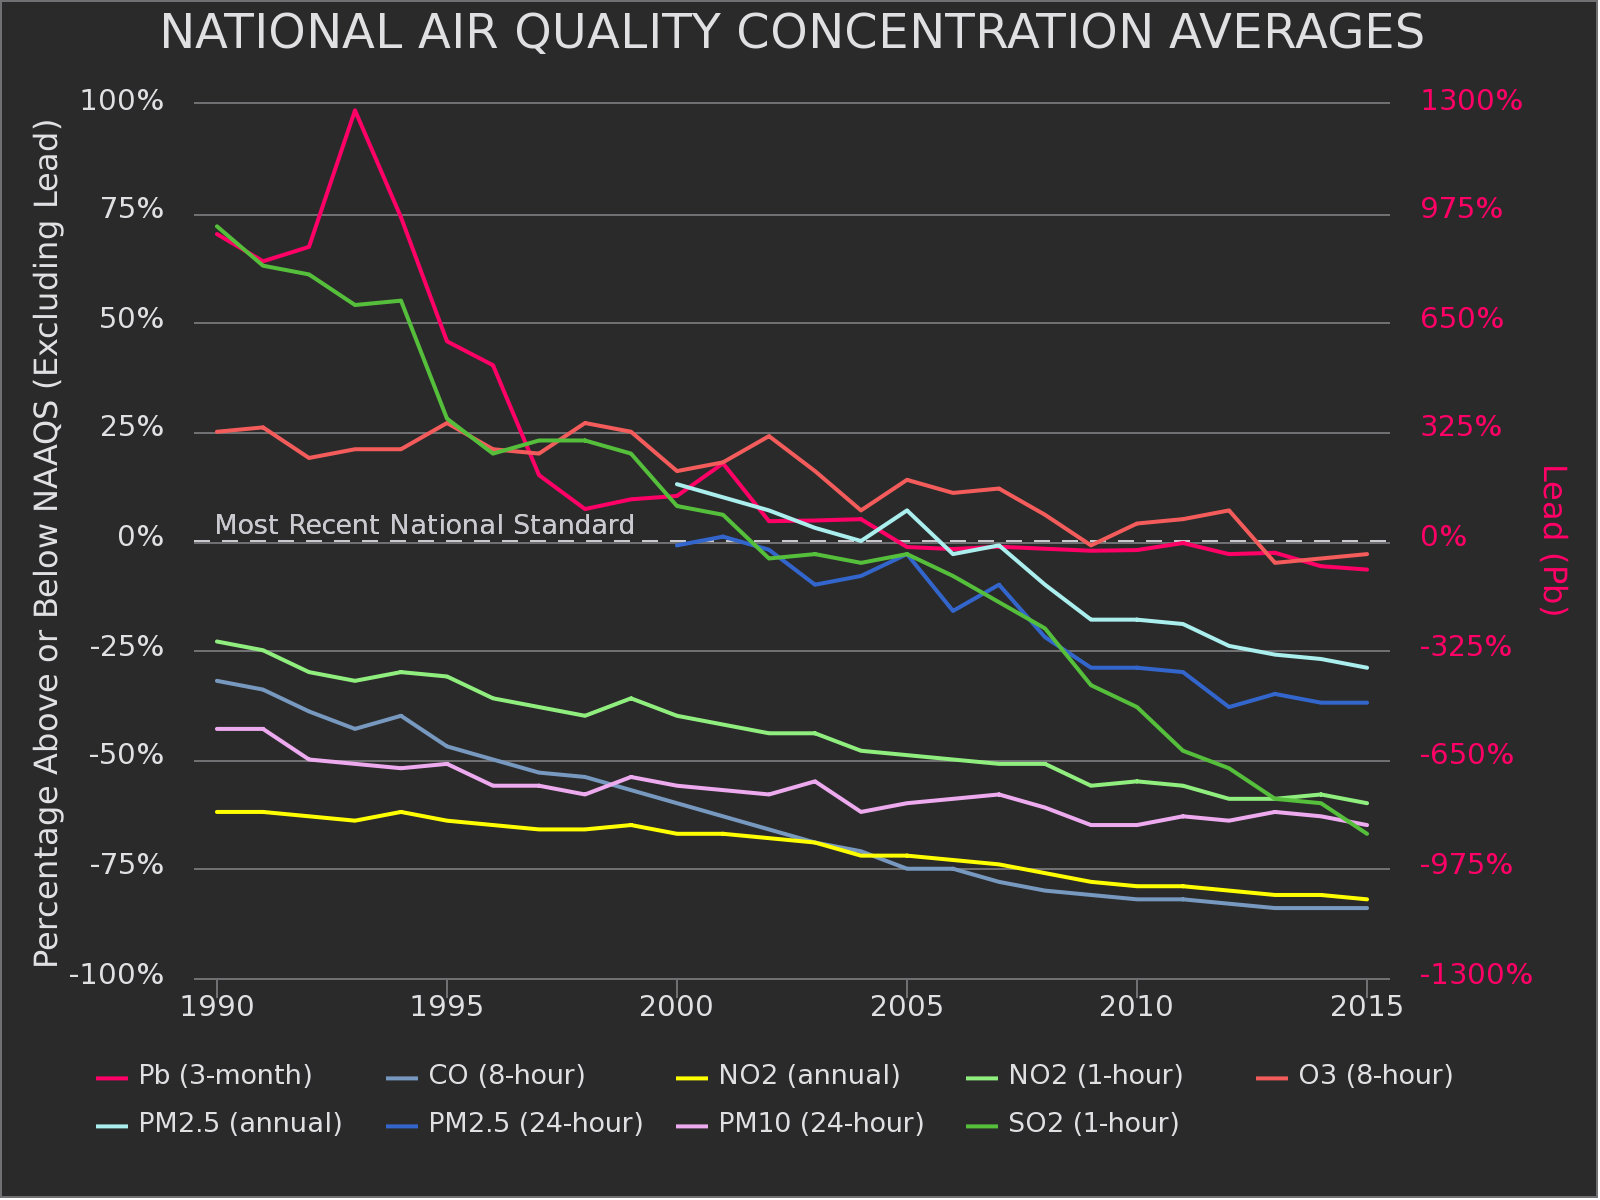
In spite of population growth and growing fossil fuel use in the US, the average national concentration of all six criteria pollutants fell between 1990 and 2010 by enforcing compliance to the NAAQS. The most dramatic reduction in air pollution is lead, which fell 99%. Nevertheless, ozone and PM remain problematic health hazards.