
Interactive
Nuclear Atlas
A global map of the world’s nuclear power plants: every site operating, under construction, retired or cancelled, sized by capacity and filterable by status and reactor type.
362
plants mapped
384 GW
active capacity
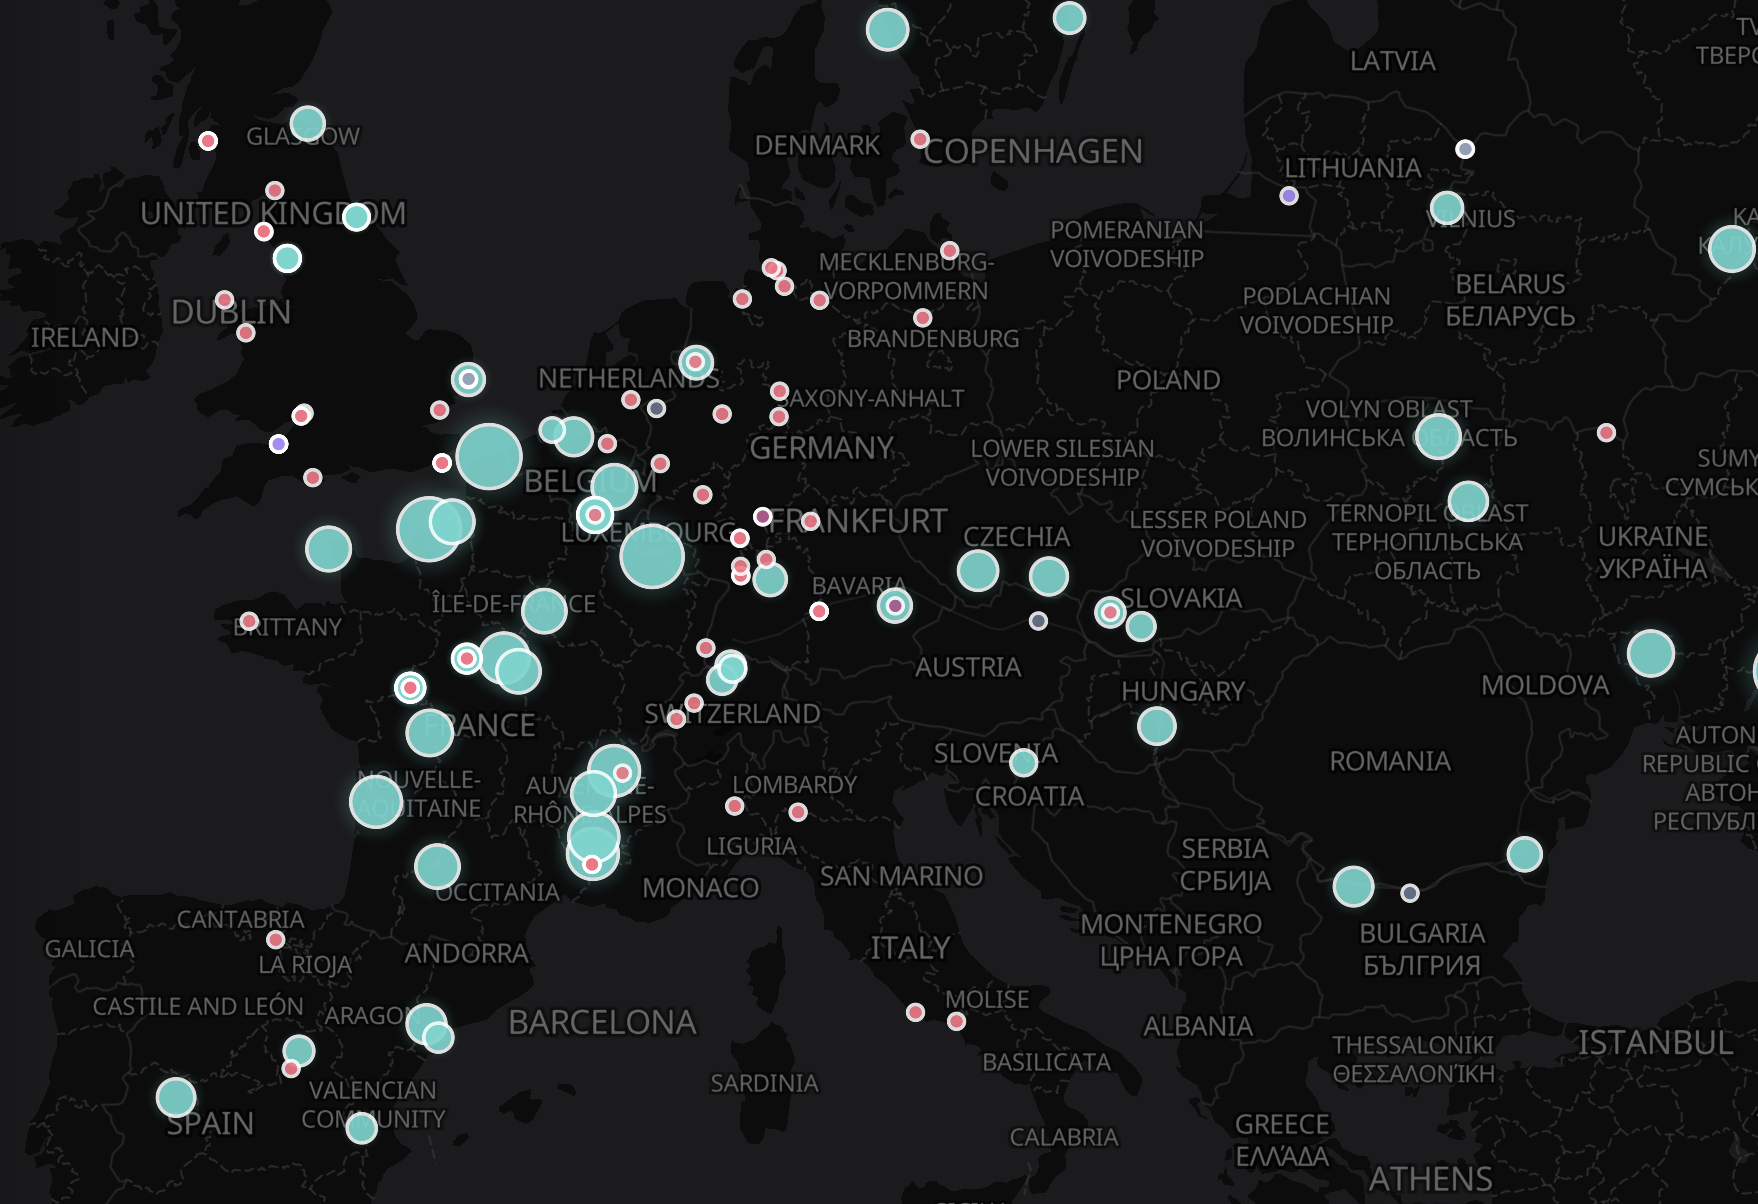
The Nuclear Atlas is an interactive map of the world’s nuclear power plants. It covers 362 plants in 40 countries, with 384 GW of capacity currently active. Each plant is drawn as a circle sized by its active capacity and coloured by status, so the operating fleet, new construction and retired sites read at a glance.
What the atlas covers
Of the 362 plants, 201 are operational, 19 are under construction and 10 are planned. A further 118 have shut down, and the remainder are suspended, cancelled or fully decommissioned. Together they hold 758 individual reactors, 422 of them operating.
Pressurized water reactors are the most common design, accounting for 452 of the 758 reactors, followed by boiling water reactors and pressurized heavy water reactors. The largest active fleets by capacity are in the United States, France, China, Japan, Russia and South Korea.
Selecting a plant shows each of its reactors with type, model, capacity, construction start and years of operation, so the history of a site can be read alongside its current status.
It is a companion to the Advanced Nuclear Tracker. The tracker follows the companies building the next generation of reactors; the atlas shows the plants already built and under way.
The data
Largest nuclear fleets by active capacity
The 15 countries with the most active nuclear capacity in the atlas, with operating and under-construction reactors. A plant counts as operating when the site’s status is operational.
Source: IAEA Power Reactor Information System (PRIS) via the Power Station Dictionary, as mapped in the atlas above.